Progress Report & Working Schedule_200313
1. Increase the R-Squared value to over 90%(failed)
Last week I made a few mistakes. The first one is, when calculating the R-Squared value, I squared the correlation coefficient, AKA the \(R\). However, only in linear least squares multiple regression with an estimated intercept term, does \(R^2\) equal the square of \(R\). Thus when I came face to face to the fact, I was too glad to find that the best model I had ever obtained with an \(R^2\) = 89.70% actually reached a terrible result with the real \(R^2\) less than 70%. Thus I spent some time re-adjusting the hyperparameter and finally reached an \(R^2\) = 89.24%.
2. Migrate the model to other rain gauges(needs improving)
After adjusting the hyperparameter, I migrated the linear and dense model to other rain gauges. The results are shown as Table 1.
Table 1 The comparison of different models and rain gauges
Station | Linear Regression | Dense | Promotion |
|---|---|---|---|
Liupanshan | 86.67% | 89.24% | 2.57% |
Guyuan | 66.21% | 82.03% | 15.82% |
Longde | 72.49% | 93.76% | 21.27% |
Jingyuan | 80.00% | 95.56% | 15.56% |
As is shown in the table, expect for the poor promotion in Liupanshan, every other rain gauge has a promotion of more than 15%, without re-adjusting the hyperparameter.
However, \(R^2\) CANNOT be used as the only method to evaluate the performance of a model. The real usage of \(R^2\) should be a reference to other similar studies if they generally acquire an \(R^2\) with a similar value. To evaluate whether a model is good or not, it finally comes back to the residual plots. I hope my mistake here would be a negative example and anyone who reads this article will take a warning when evaluating a regression model.
I'll write another article later specialized for the principle and explanation above. Let's see now what stupid mistakes I made.
Figure 1~4 shows the residual plots of Liupanshan, Guyuan, Longde, and Jingyuan, respectively.
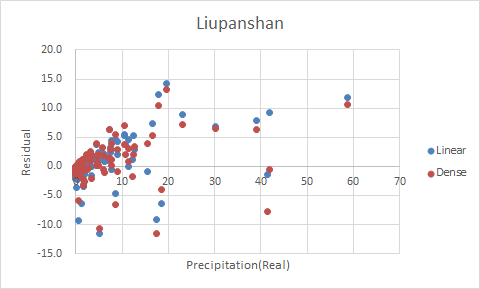
Figure 1 Residual Plot of Liupanshan
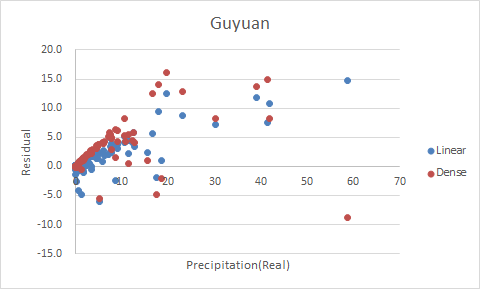
Figure 2 Residual Plot of Guyuan
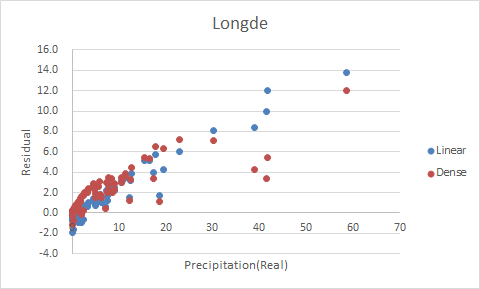
Figure 3 Residual Plot of Longde
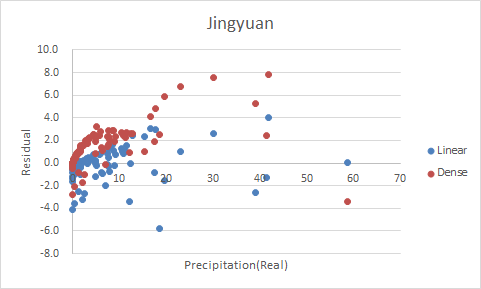
Figure 4 Residual Plot of Jingyuan
Though the other three rain gauges gain a huge promotion in \(R^2\), the residual plots of Jingyuan and Longde are almost linear, indicating that there's a linear relationship between the residual and the precipitation and that the model still needs improving. Also, the residual of Dense model appears to be larger than linear model in Guyuan and Jingyuan. The only residual plot that barely makes sense is the one of Liupanshan. Sarcastic, huh?
3. Deal with the meteorological data(finished)
Nothing much to say. For features except for wind direction and wind velocity, the hourly-features are grouped by day and are taken by mean. For wind direction, it is firstly split into 16 directions according to the degree of the wind. Then weight the direction by velocity so as to obtain the leading wind direction. After getting the direction, take the mean of velocity with the range of the leading direction.
When dealing with the wind features, less than 30 abnormals out of about 9,000 pieces of data are found and processed simply.
4. Working Schedule
Adjusting the paper.
Re-adjust the model and pay more attention on residual distribution and residual plots.
Sort out the problems and mistakes I came up with in the past 2 weeks and write some more articles.
本文章使用limfx的vsocde插件快速发布